
Price Performance
Bitcoin has experienced its most significant correction since late 2022. This follows several months of sideways price action, pushing it below the 200DMA. A significant number of Short-Term Holders are now in an unrealized loss.
Similarities and Differences in the 2023-24 Cycle
The 2023-24 Bitcoin cycle shows both similarities and differences to previous cycles. After FTX collapsed, the market saw 18 months of steady price growth. This was followed by three months of range-bound prices post the $73k ETF high. The deepest correction occurred between May and July, with a drawdown exceeding -26% from the ATH.
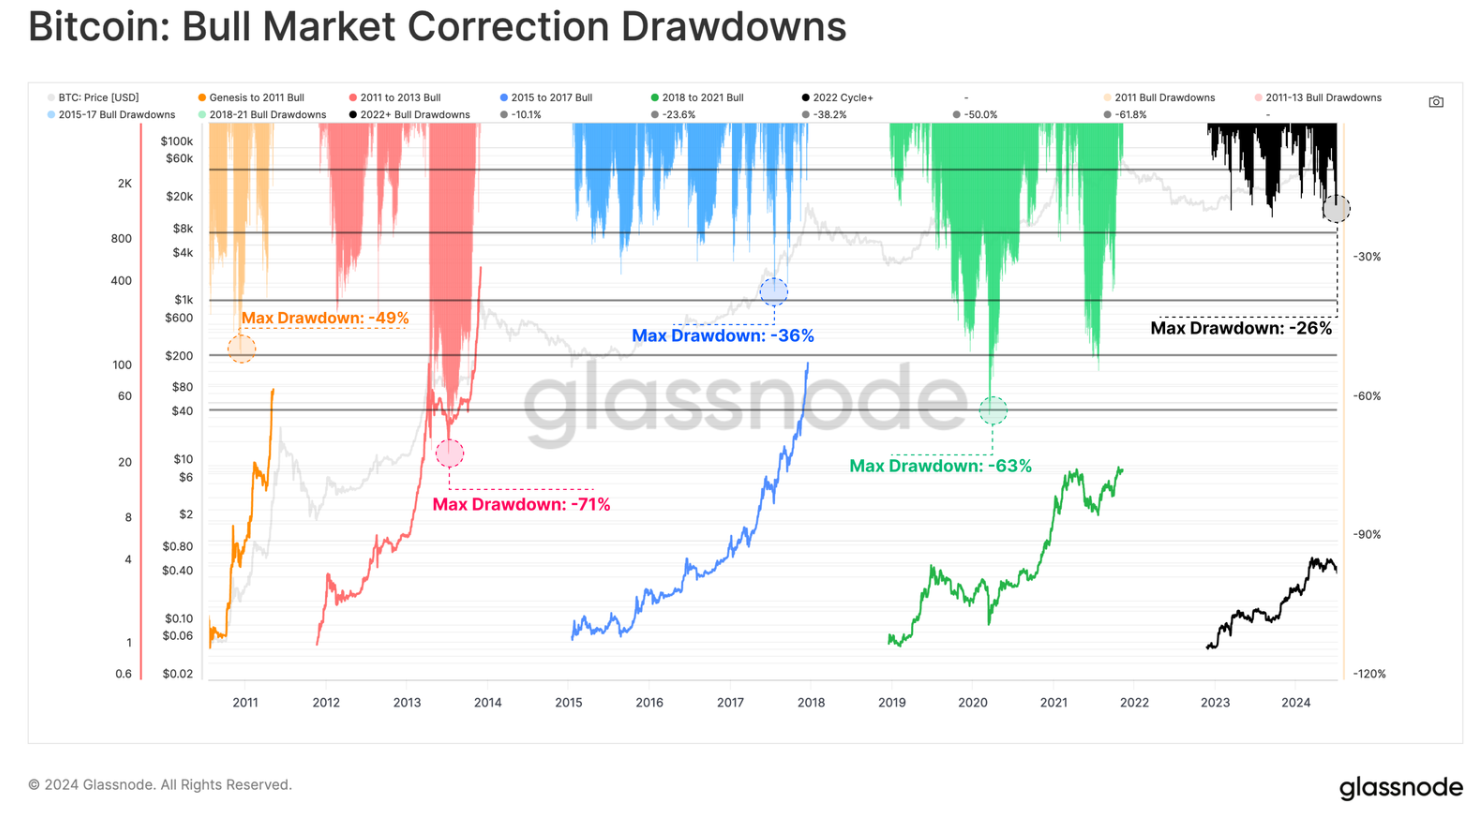
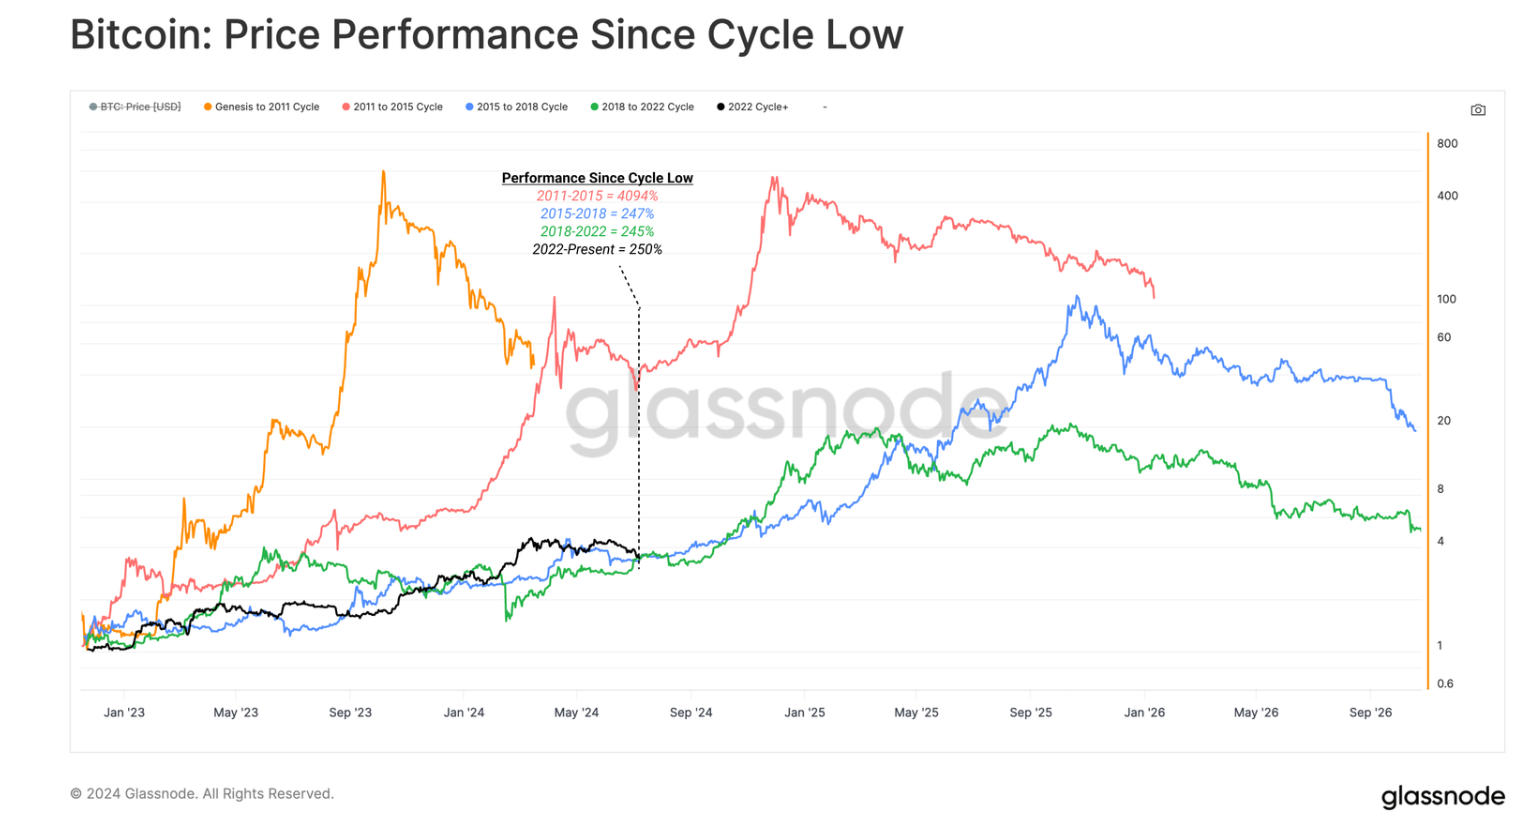
Despite the downturn, this cycle’s downtrend has been shallower than previous ones. This indicates a robust underlying market structure and less volatility as Bitcoin matures as an asset class. When comparing price performance to each cycle low, the 2023-24 market mirrors the last two cycles (2018-21 and 2015-17).
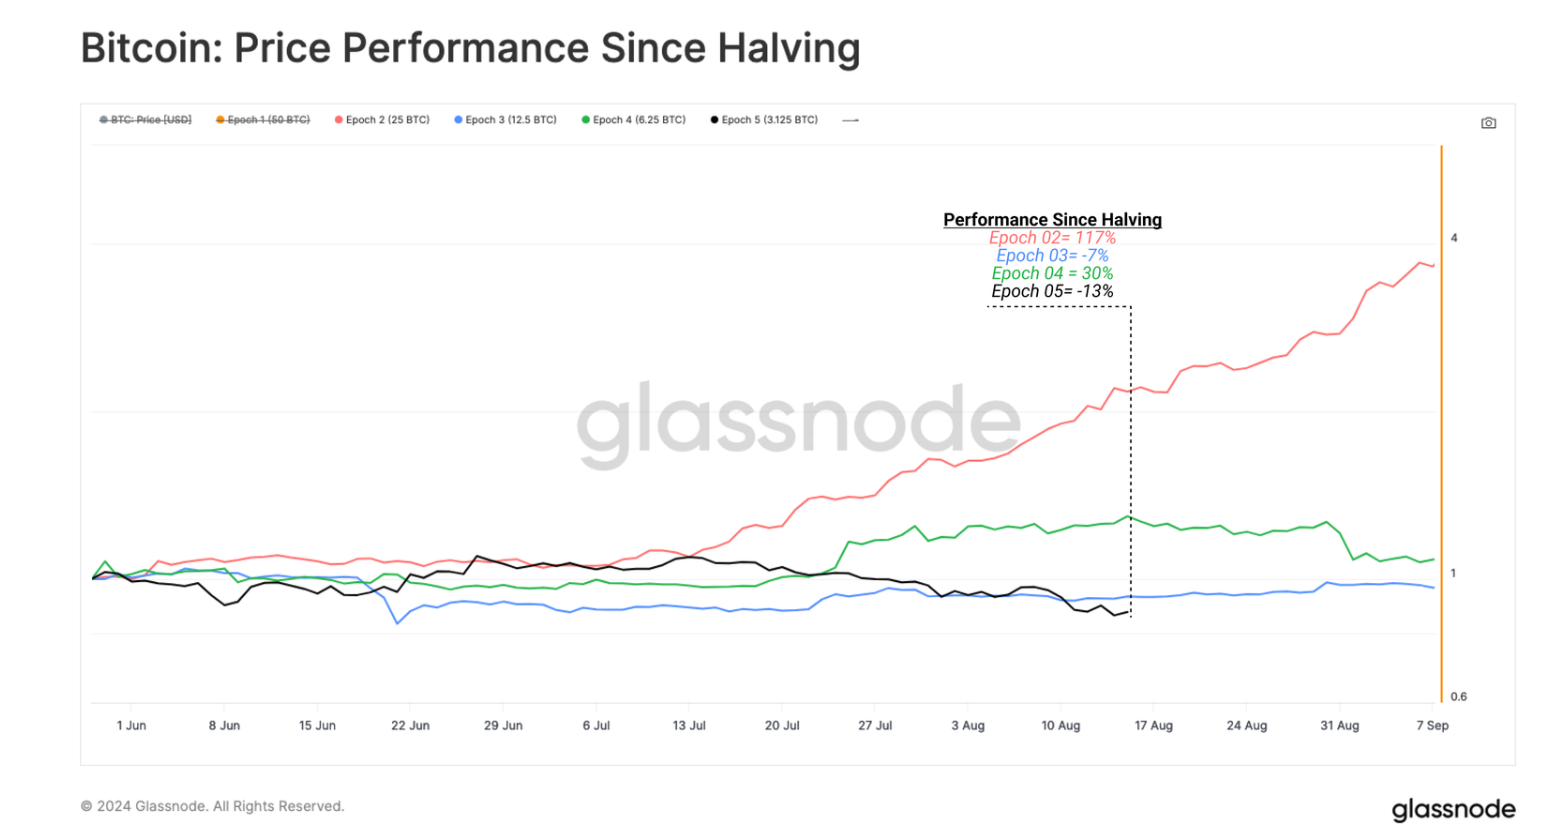
However, when indexed to the Bitcoin halving date, the current cycle is among the worst performing. This is despite reaching a new cyclical ATH before the April halving, a first-time occurrence.
Cycle Performance Indexed to Bitcoin Halving
- Epoch 2: +117%
- Epoch 3: -7%
- Epoch 4: +30%
- Epoch 5: -13%
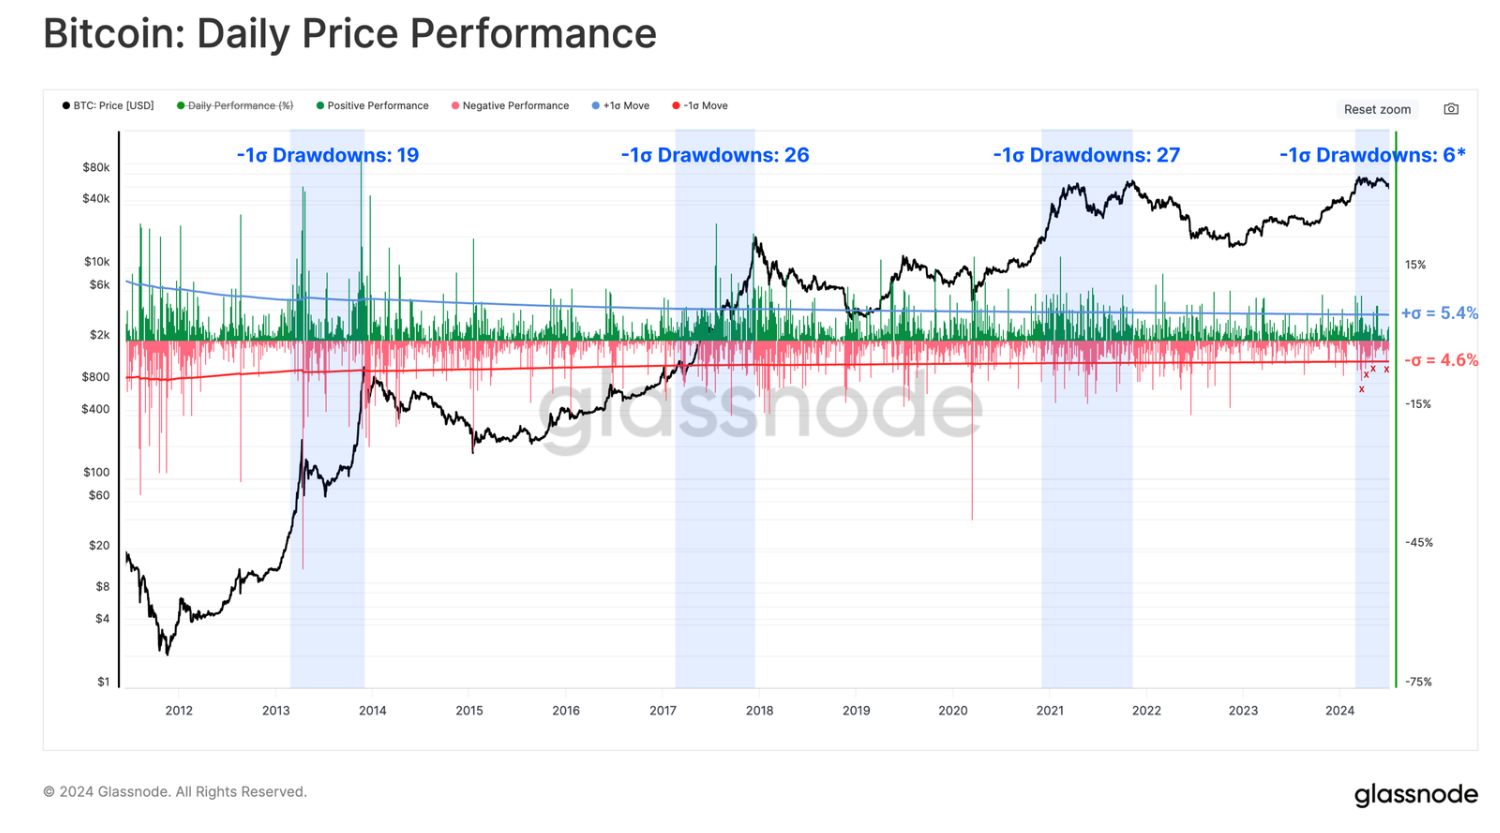
Daily Drawdowns During Uptrends
Evaluating daily drawdowns exceeding the 1 Standard Deviation threshold helps assess sell-off events during bull market uptrends.
- 2011-13: 19 Events
- 2015-18: 27 Events
- 2018-21: 26 Events
- 2023-24: 6 Events (to date)
The current cycle has only recorded six significant drawdowns. This suggests a shorter, less volatile cycle or more potential investor activity.
New Investors Underwater
Since January 2024, Short-Term Holders’ supply has grown substantially. This growth coincided with explosive price action from the spot ETFs launch, reflecting strong new demand. However, demand has plateaued recently, suggesting a Q2-2024 equilibrium between supply and demand. A supply overhang has since developed, as fewer Long-Term Holders take profits and new buyers accumulate less.
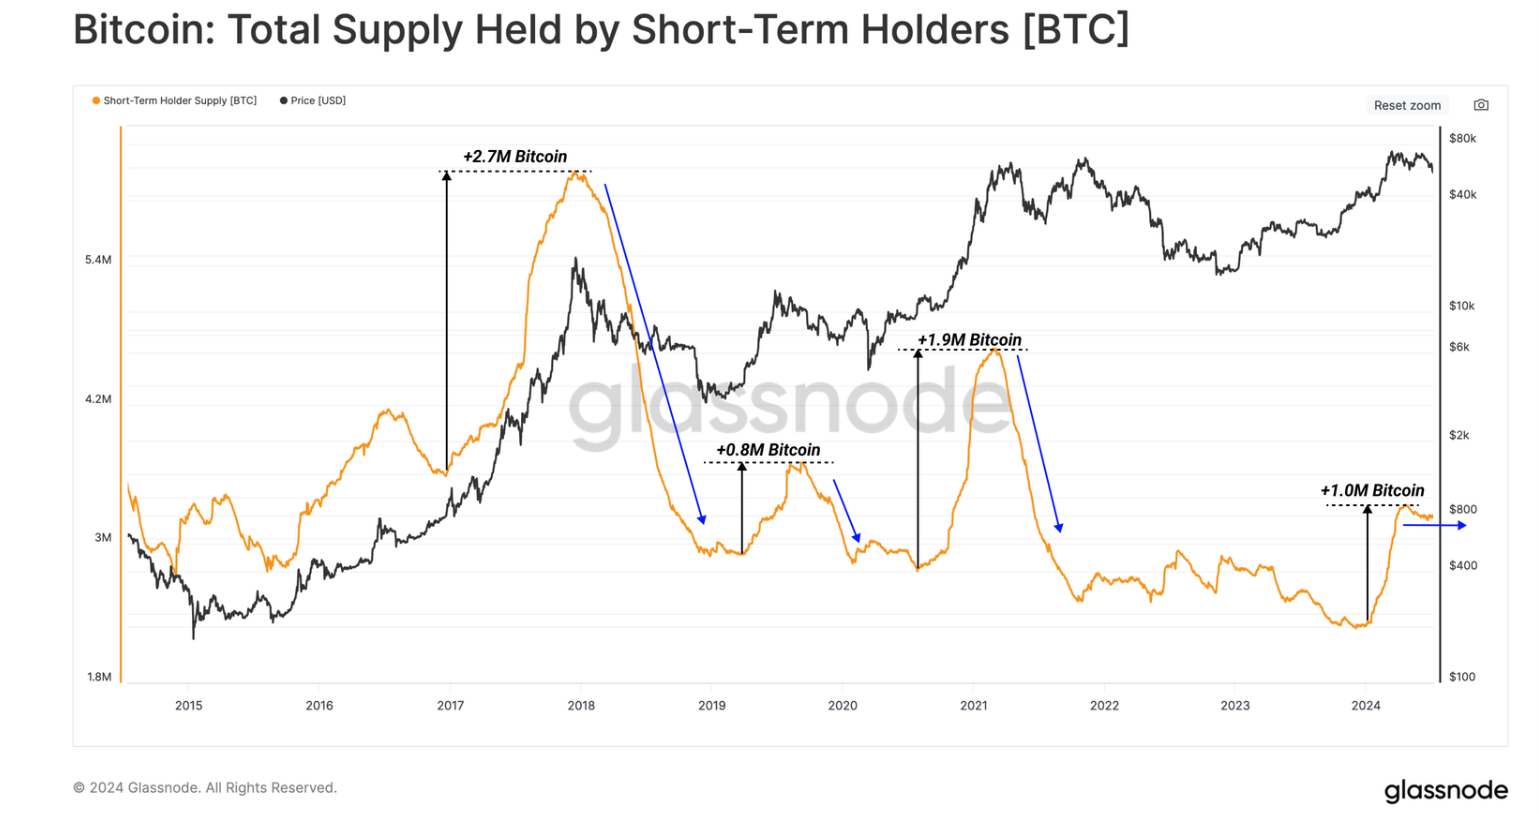
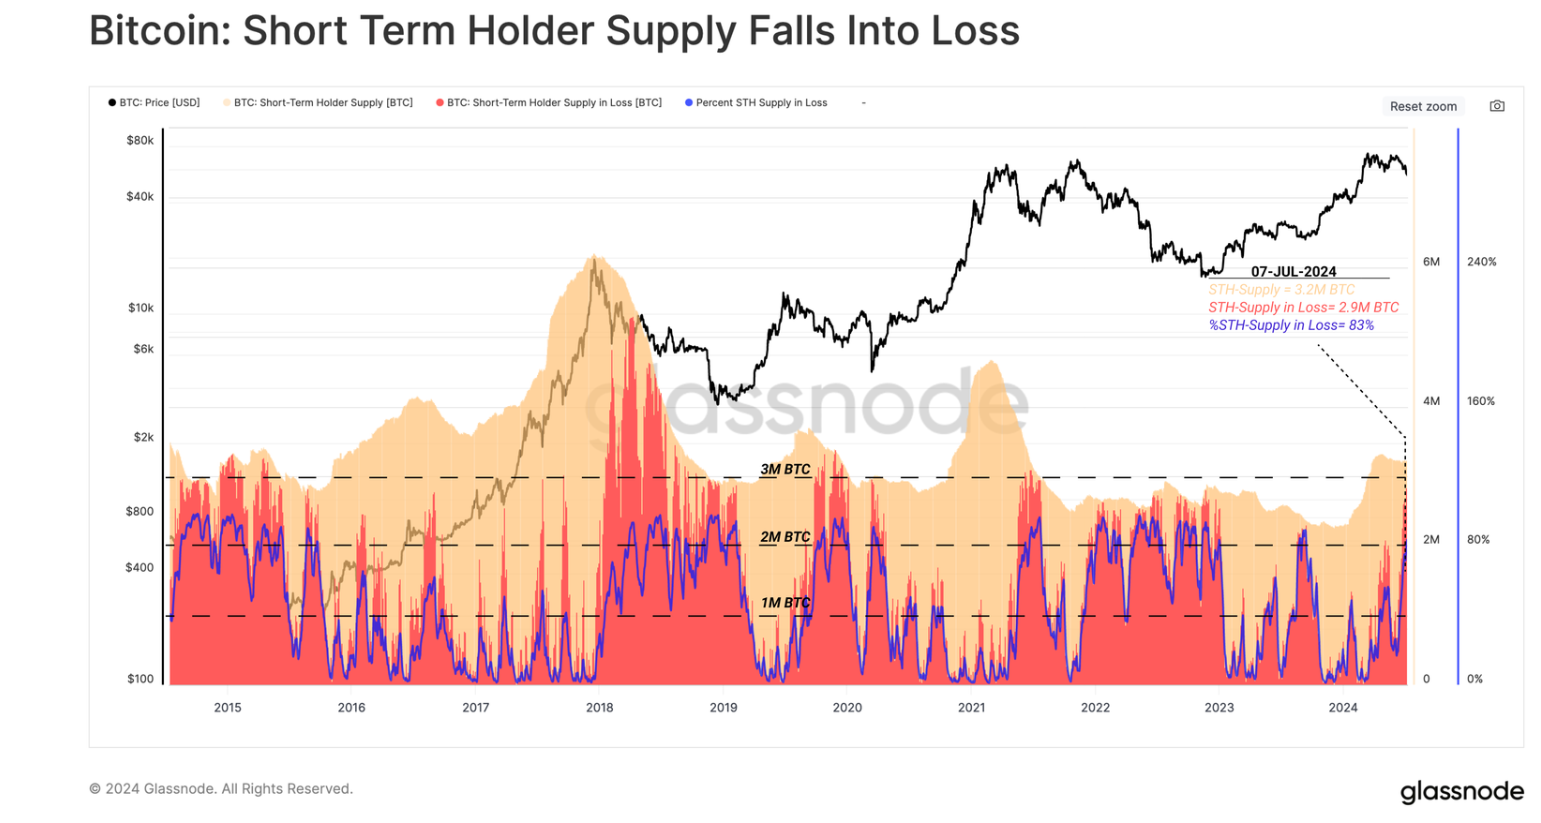
Local Bottoms in Bull Markets
Local bottoms are often established when Short-Term Holder supply in loss saturates around 1M to 2M BTC. In severe cases, this can peak between 2M and 3M BTC.
Recent sell-offs to the $53k price level pushed coins held below cost basis to over 2.8M BTC. This is the second instance in 12 months, with August 2023 also seeing over 2M BTC in unrealized loss.
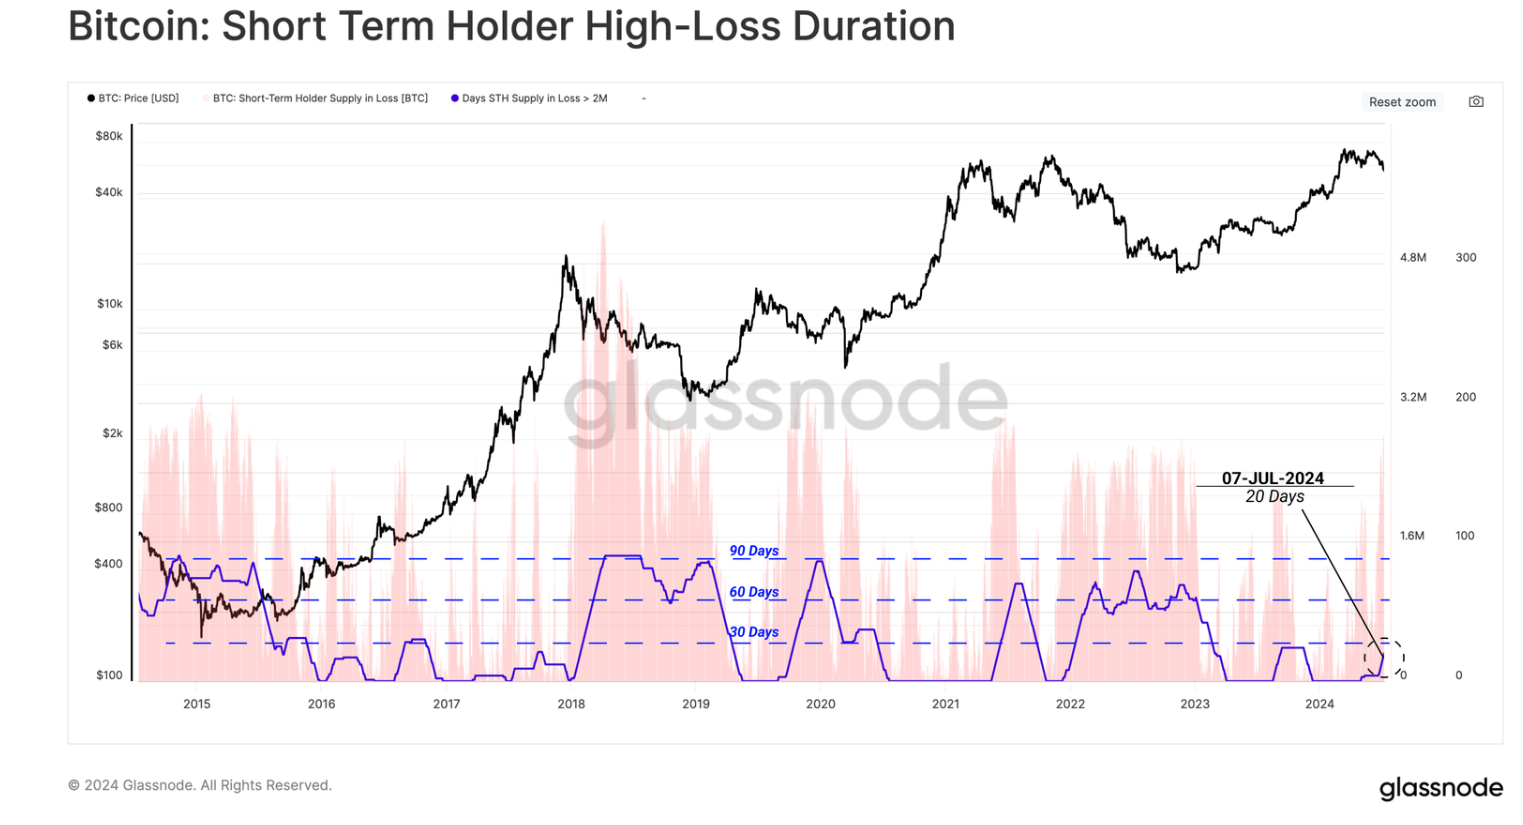
Intensity of Short-Term Holder Losses
By counting days with over 2M Short-Term Holder coins underwater for at least 90 days, the indicator has flagged for 20 days.
Comparing this to Q2-Q3 2021, the previous period saw 70 consecutive days of severe financial stress. That stress broke investor sentiment, leading to the 2022 bear market. The current cycle has been relatively forgiving so far.
A Halt on Profitability
Spot price contraction has decreased the Realized Profit to Realized Loss ratio to the 0.50 to 0.75 range, a neutral level seen during bull market corrections. Similar sharp fluctuations occurred throughout the 2019 to 2022 cycle, reflecting instability and uncertainty.
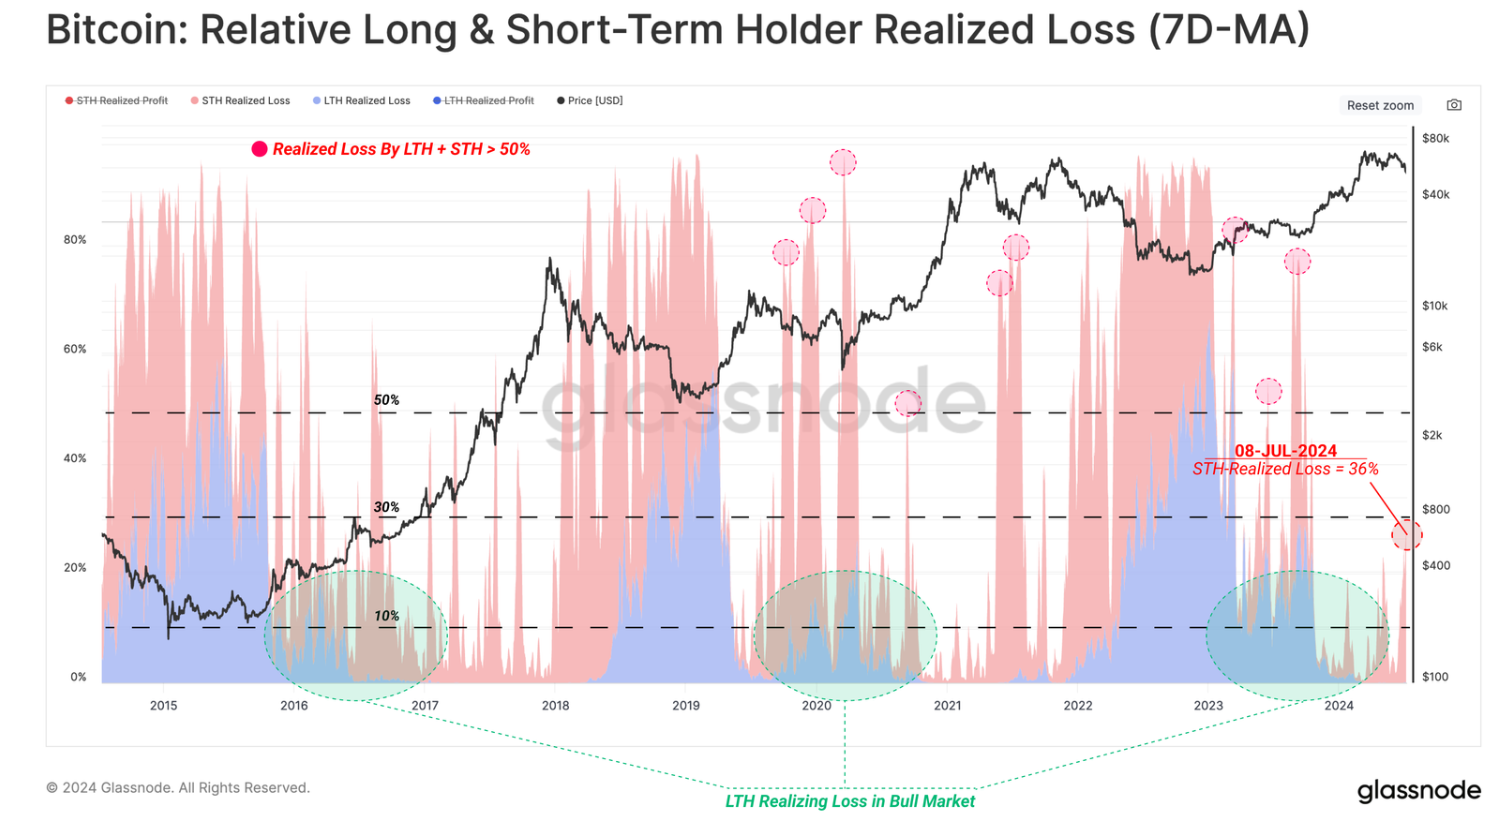
Short-Term Holder Losses
This week, Short-Term Holders realized losses totaling ~$595m, the largest since the 2022 cycle low. Only 52 out of 5655 trading days have recorded larger daily losses. However, relative losses remain typical compared to previous bull market corrections.
Periods where Short-Term Supply in Loss and magnitude of losses moved more than 1 standard deviation from the mean have been highlighted. This week’s loss events account for less than 36% of total capital flows across the Bitcoin network.
Comparison to Major Capitulation Events
Major capitulation events like Sep 2019, March 2020, and May 2021 saw losses exceed 60% of capital flows over several weeks. The current market contraction is more similar to the Q1-2021 topping formation than severe capitulation events.
Demand Side’s Role
The demand side must arrest negative price momentum, or investor profitability will continue to deteriorate.
Summary and Conclusion
After 18 months of price growth post-FTX collapse and three months of sideways trading, the market faced its deepest correction of the cycle. Drawdowns remain favorable compared to historical cycles, suggesting a robust underlying market structure. Short-Term Holders face severe unrealized losses, but the magnitude of losses is subdued relative to market size. Long-Term Holders remain profitable, despite market hysteria.