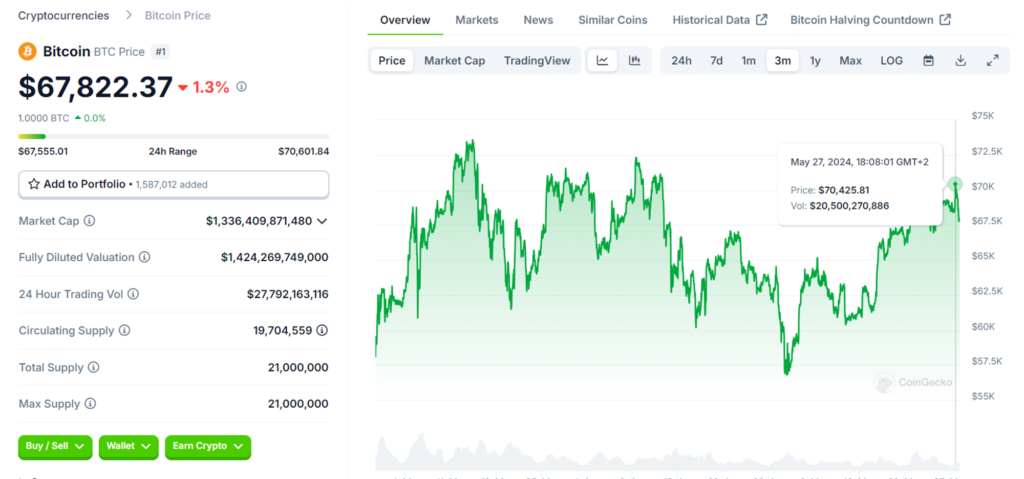
Bitcoin Price Surges Past $70,000 Amid Improved Market Sentiment
Bitcoin’s price climbed above the psychological level of $70,000 during the overnight session, reflecting improved sentiment in the industry. The BTC/USD pair was trading at 70,100 as bulls targeted last week’s high of 72,000.
Factors Behind Bitcoin’s Rally
Bitcoin’s rally accelerated after the U.S. Securities and Exchange Commission (SEC) approved three spot Ether ETFs. These funds cannot be traded yet as the agency reviews other applications to maintain fairness.
The approval of the Ether ETFs came a few months after the SEC greenlit spot Bitcoin ETFs, which have been highly successful. For instance, the iShares Bitcoin Trust (IBIT) has grown into an $18 billion fund and is expected to surpass the Grayscale Bitcoin Trust.
BTC/USD Technical Analysis
The daily chart shows that Bitcoin’s price has been in a sideways trend over the past few days. An inverse head and shoulders pattern, a popular bullish signal, has formed. Bitcoin has also risen above the 50-day and 25-day Exponential Moving Averages (EMA), which recently formed a bullish crossover.
Additionally, the pair has moved above the Ichimoku cloud indicator and is nearing the neckline of the inverse head and shoulders pattern. Both the Relative Strength Index (RSI) and the MACD indicators are pointing upwards.
Therefore, technically, the outlook for the pair is bullish. This view will be confirmed if the price moves above the slanting neckline of the head and shoulders pattern. If this happens, the pair is likely to reach its all-time high of over 73,800.
The stop-loss for this pattern is set at 65,000. A break below this level could lead to a decline towards the head section of the pattern, which is this month’s low of 57,000.
BTC/USD 4-Hour Chart Analysis
The 4-hour chart reveals that the BTC/USD pair has risen sharply in recent days, forming another small inverse head and shoulders pattern. The price has also moved slightly above the neckline of this pattern.
Bitcoin has also risen above the 50-period and 25-period moving averages and the key resistance at 67,275, its highest level on April 22nd. Therefore, similar to the daily chart, the pair is likely to experience a bullish breakout, with the initial target being 71,973, its highest level last week. According to CoinFactiva analysts, a break above this level could pave the way for a move to the all-time high.

BTC/USD Forex Signal: Bitcoin Forms Two Inverse Head and Shoulders Patterns
Bullish Scenario:
- Buy the BTC/USD pair and set a take-profit at 71,980.
- Add a stop-loss at 67,000.
- Timeline: 1-2 days.
Bearish Scenario:
- Set a sell-stop at 69,000 and a take-profit at 67,000.
- Add a stop-loss at 72,000.

